Does trading a slower chart actually help?
The standard advice is to move up a timeframe when you are losing on a fast one. We tested the same five strategies on the same four pairs across five timeframes to see whether the chart makes the difference people claim.
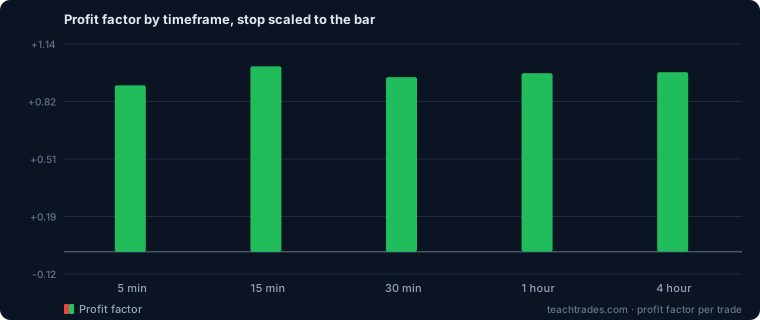
The result
| Timeframe | Trades | Per run | Avg PF | Out-of-sample PF | Profitable runs | Net pips |
|---|---|---|---|---|---|---|
| 5m | 11,760 | 588 | 0.91 | 0.93 | 1/20 | -8,029 |
| 15m | 3,819 | 191 | 1.01 | 0.86 | 11/20 | +141 |
| 30m | 3,808 | 190 | 0.95 | 1.02 | 7/20 | -2,474 |
| 1h | 3,859 | 193 | 0.98 | 1.04 | 8/20 | -3,123 |
| 4h | 1,484 | 74 | 0.98 | 1.09 | 9/20 | -5,232 |
Best average profit factor: 15m at 1.01. Worst: 5m at 0.91. The spread between them is small — much smaller than most people expect, and much smaller than the difference between pairs on the same timeframe.
What actually changes
Trade count, enormously. The 5-minute chart produced roughly 8× the trades of the 4-hour. Since the spread is paid per trade and not per hour, that is 8× the cost for the same six months of market.
That is the real mechanism behind "move up a timeframe". It is not that the slower chart is cleaner or that the signals are better. It is that you trade less, so you pay less. If your strategy has a genuine edge, a slower chart gives you fewer chances to use it; if it does not, a slower chart simply bleeds you more slowly.
What does not change
A strategy without an edge does not acquire one on a slower chart. The best timeframe here is 15m, and it is barely break-even — +141 pips across 3,819 trades, which is zero with extra steps. Nothing in this table turns a losing set of strategies into a winning one. It only changes how fast they lose.
We ran this wrong the first time
The original version of this experiment held the stop at 20 pips on every timeframe. That sounds neutral and is not. A 20-pip stop is about eight 5-minute bars wide and about one 4-hour bar wide — so on the slow charts the stop was sitting inside a single bar’s normal range and getting hit by noise that carried no information at all.
It produced a confident answer, and the answer was backwards:
| Timeframe | Fixed 20-pip stop (wrong) | Stop scaled to the bar (this page) |
|---|---|---|
| 5m | PF 1.05 · 16/20 profitable | PF 0.91 · 1/20 profitable |
| 15m | PF 1.01 · 13/20 | PF 1.01 · 11/20 |
| 30m | PF 0.87 · 1/20 | PF 0.95 · 7/20 |
| 1h | PF 0.87 · 0/20 | PF 0.98 · 8/20 |
| 4h | PF 0.91 · 5/20 | PF 0.98 · 9/20 |
The first run said fast charts were clearly best and hourly charts were a disaster. It was measuring its own stop distance. We are showing it because this is the single commonest way a backtest lies to you: not by getting the arithmetic wrong, but by quietly holding something constant that should have scaled, and then reporting the consequence as a discovery.
If you take one thing from this page, take that rather than the ranking.
The honest caveat
Higher timeframes have fewer trades, so their numbers carry more uncertainty. A 4-hour run with forty trades can look excellent or dreadful on luck alone; a 5-minute run with two thousand cannot. Weight the rows by the trade count, not by the profit factor.
Try your own
The strategy tester covers 5-minute to daily, with history stretching back further on the slower frames — five years on daily, because six months of daily candles is about 130 bars and that is an anecdote, not a sample.
Want the setups, not just the maths?
Our own signals run on a fast chart and pay for it in spread, which is why every result we publish is net of that cost.
See today’s signals →