What the spread actually costs you
We ran 30 strategy backtests twice — once paying the real spread, once with it set to zero. Everything else was identical. 8 of them are profitable only in the version where trading is free.
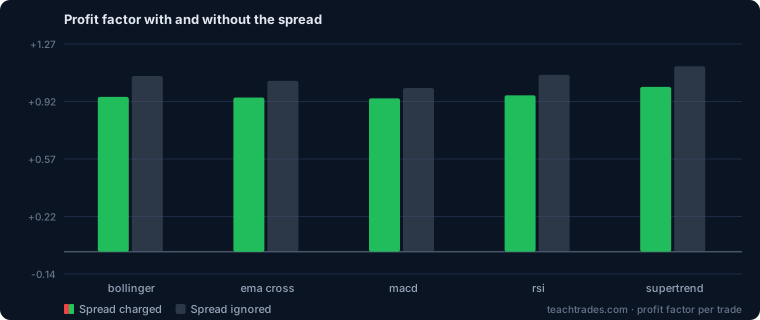
The result
| Profitable paying the spread | 16 of 30 |
| Profitable if the spread were free | 24 of 30 |
| Pooled result, as traded | -7,408 pips |
| Pooled result, spread ignored | +6,455 pips |
| Total cost of the spread | 13,863 pips |
The same set of strategies is a +6,455 pip winner in a world with no costs and a -7,408 pip loser in this one. Nothing else changed — same entries, same exits, same bars.
The eight that only work when trading is free
These cross from profitable to losing purely because of the spread. If you have ever backtested something, liked the curve, and then watched it bleed in a live account, this is the most likely reason.
| Pair | Strategy | PF as traded | PF if the spread were free |
|---|---|---|---|
| EURUSD | rsi | 0.9 | 1.0 |
| USDJPY | macd | 0.99 | 1.06 |
| AUDUSD | bollinger | 0.99 | 1.17 |
| GBPJPY | ema_cross | 0.9 | 1.07 |
| GBPJPY | rsi | 0.85 | 1.02 |
| GBPJPY | macd | 0.83 | 1.0 |
| GBPJPY | supertrend | 0.86 | 1.06 |
| USDCAD | supertrend | 0.77 | 1.01 |
Where it hurts most
| Pair | Strategy | Trades | Spread | PF as traded | PF if free | Cost |
|---|---|---|---|---|---|---|
| GBPJPY | rsi | 714 | 2p | 0.85 | 1.02 | 1,692 pips |
| GBPJPY | macd | 631 | 2p | 0.83 | 1.0 | 1,474 pips |
| GBPJPY | bollinger | 649 | 2p | 0.81 | 0.95 | 1,227 pips |
| GBPJPY | supertrend | 434 | 2p | 0.86 | 1.06 | 1,138 pips |
| GBPJPY | ema_cross | 422 | 2p | 0.9 | 1.07 | 924 pips |
| USDJPY | rsi | 480 | 1p | 1.05 | 1.2 | 857 pips |
| USDCAD | bollinger | 241 | 1.4p | 0.72 | 0.96 | 737 pips |
| USDCAD | supertrend | 198 | 1.4p | 0.77 | 1.01 | 575 pips |
Two things drive the cost, and they multiply. The spread on the pair — GBPJPY at 2.0 pips is twice EURUSD at 0.8. And how often you trade — a strategy taking 700 trades pays that spread 700 times.
That combination is why the worst rows above are all the same pair. A high-frequency strategy on an expensive cross is paying the spread twice over, and no amount of indicator tuning gets that money back.
The arithmetic nobody does first
Before testing anything, multiply. A strategy averaging 400 trades in six months on a 2-pip pair pays 800 pips in spread. If its edge is 3 pips a trade, the edge is 1,200 pips and it keeps a third of it. If its edge is 2 pips a trade, it has no edge at all, and no amount of parameter tuning will create one — tuning only ever changes what the trades are, not what they cost.
This is also the honest reason most scalping strategies fail. They are not wrong about direction often enough to explain the losses. They are right just often enough, and then hand it all to the spread.
What to do with this
- Only backtest with costs on. A backtester that does not charge the spread is not measuring trading; it is measuring a different game that happens to use the same charts.
- Count your trades before you count your pips. Trade frequency is a cost multiplier, and the strategies that look most active are usually the ones paying the most.
- Prefer cheap pairs for short-term work. The same signal on EURUSD at 0.8 keeps more than on GBPAUD at 2.5.
- Treat any published backtest without a spread column as fiction.
Check it yourself
Our free strategy tester charges each pair’s real spread on every trade, and the profit calculator shows what a round trip costs per lot on each pair. Neither needs an account.
Want the setups, not just the maths?
Our own published record is net of the same costs — every signal fills at a real price and every loss stays on the board.
See today’s signals →