What actually happens after a trade hits its first target
Roughly half of them keep going. The other half come back and take your profit with them — which is the whole argument for moving a stop, and the reason the argument is not as one-sided as it sounds.
The headline
Of 511 trades that reached their first target, 269 went on to the second — 52.6%. 114 reached the third, 22.3%.
So a little over half of the trades that give you a profit at TP1 will give you more if you let them. Just under half will not, and if your stop is still at its original distance those ones hand the profit back and then some.
Every outcome, 1,032 trades
| Outcome | Count | Share | Avg pips | Total pips |
|---|---|---|---|---|
| TP3 | 114 | 11.0% | +47.3 | +5,387.3 |
| TP2 | 155 | 15.0% | +28.8 | +4,471.7 |
| TP1 | 242 | 23.4% | +18.0 | +4,363.5 |
| BE | 253 | 24.5% | +8.4 | +2,135.6 |
| SL | 268 | 26.0% | -16.4 | -4,402.7 |
The row worth staring at is BE. Those are trades where the stop had already been moved up and then got hit — and they average +8.4 pips, not zero. That is the difference between moving a stop to break even and moving it to a level that locks something in. Across 253 trades it is worth +2,136 pips; at a flat break-even it would have been approximately nothing.
It depends heavily on the pair
| Pair | Reached TP1 | Went on to TP2 | Reached TP3 |
|---|---|---|---|
| GBPJPY | 83 | 55.4% | 26.5% |
| EURJPY | 57 | 57.9% | 24.6% |
| GBPUSD | 54 | 46.3% | 18.5% |
| USDJPY | 49 | 38.8% | 12.2% |
| AUDJPY | 47 | 42.6% | 21.3% |
| EURUSD | 40 | 55.0% | 27.5% |
| USDCHF | 31 | 38.7% | 9.7% |
| NZDUSD | 30 | 60.0% | 30.0% |
| USDCAD | 27 | 70.4% | 25.9% |
| AUDUSD | 24 | 50.0% | 16.7% |
| GBPCHF | 22 | 72.7% | 36.4% |
GBPCHF continued past the first target 73% of the time. USDCHF managed 39%. Same strategy, same rules, same period — a spread of 34 percentage points.
That matters more than the average does. A rule like "always hold for TP2" is a good rule on GBPCHF and a bad one on USDCHF, and the average of the two tells you to do something that is wrong on both. Sample sizes are in the table so you can judge how much weight each row carries — the smaller ones are suggestive, not settled.
What we do with this
We move the stop once a trade is meaningfully in front, and we move it to a level that keeps some profit rather than to entry. The table above is why: at a flat break-even, the 253 trades in that row would have closed at nothing instead of +2,136 pips, and the 47% of TP1 trades that reverse would still have reversed.
It is not free. Moving a stop up means some trades that would have reached TP2 or TP3 get stopped out early instead — that cost is real and it is inside these numbers already. The question is never whether a stop move costs you something, it is whether it costs less than the reversals do.
Test it rather than believe it
Our record is one strategy on fourteen pairs over five months. That is enough to be interesting and not enough to be a law. The free strategy tester lets you run the same question against six months of 5-minute data on whatever strategy you like, with the break-even and trailing options built in, and it reports the out-of-sample half separately so you can see whether the answer survives.
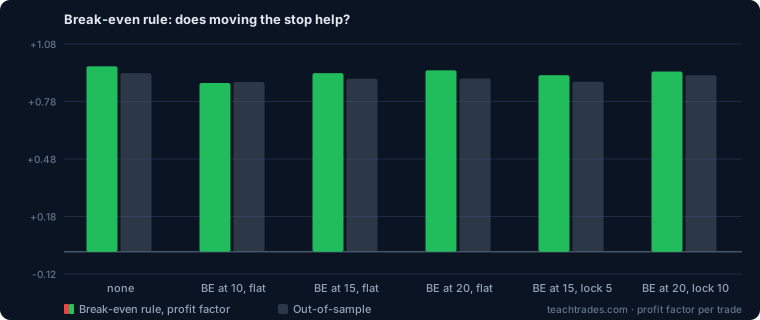
When we ran that sweep ourselves, break-even rules looked better on the data we tuned against and worse on the data we did not. That result is written up in does moving your stop to break even actually help.
Want the setups, not just the maths?
Every signal above was published before its outcome was known, with entry, stop and three targets. The whole record is public, losses included.
See today’s signals →